How to Integrate Grafana and Prometheus
All system components are now installed, but Grafana and Prometheus are not set up to interact. The remaining configuration tasks, including adding Prometheus as the data source and importing a dashboard panel, can be accomplished using the Grafana web interface.
To integrate Grafana and Prometheus, follow the steps below:
Using a web browser, visit port
3000of the monitoring server. For example, enterhttp://local_ip_addr:3000, replacinglocal_ip_addrwith the actual IP address. Grafana displays the login page. Use the user nameadminand the default passwordadmin. Change the password to a more secure value when prompted to do so.
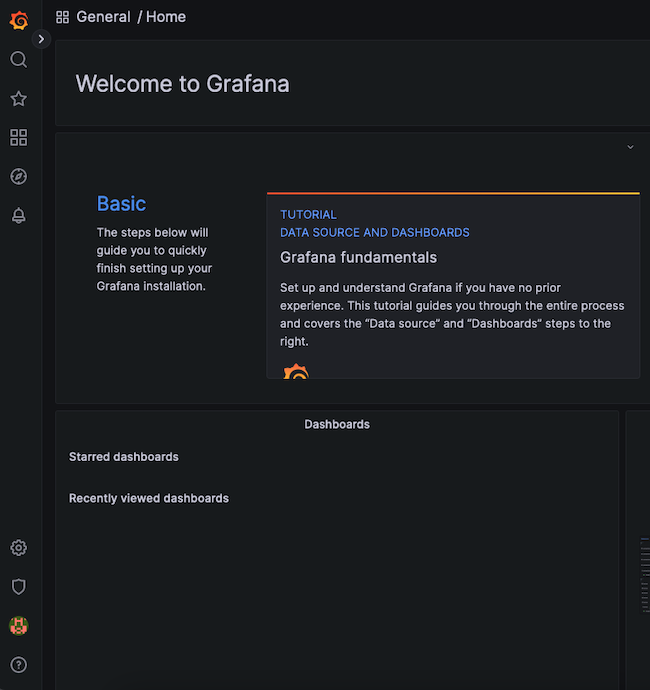
After a successful password change, Grafana displays the Grafana Dashboard.
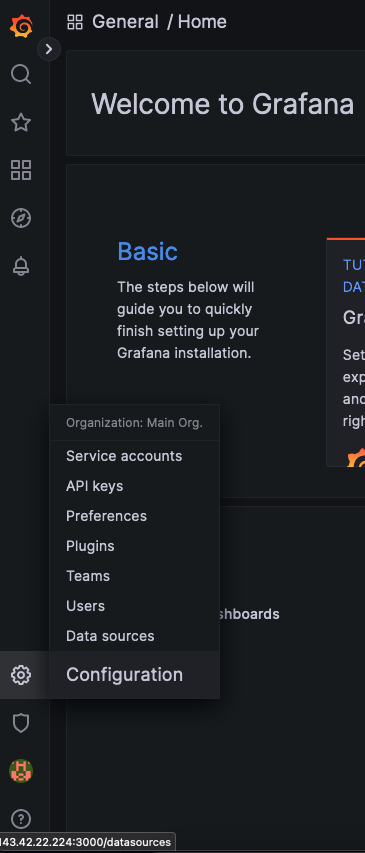
To add Prometheus as a data source, click the gear symbol, standing for Configuration, then select Data Sources.
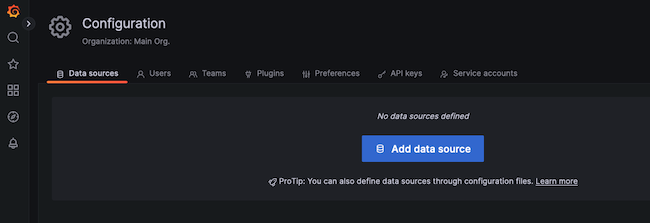
At the next display, click the Add data source button.
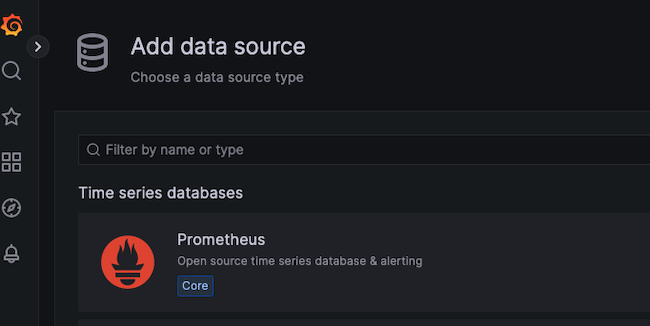
Choose Prometheus as the data source.
For a local Prometheus source, as described in this guide, set the URL to
http://localhost:9090. Most of the other settings can remain at the default values. However, a non-defaultTimeoutvalue can be added here.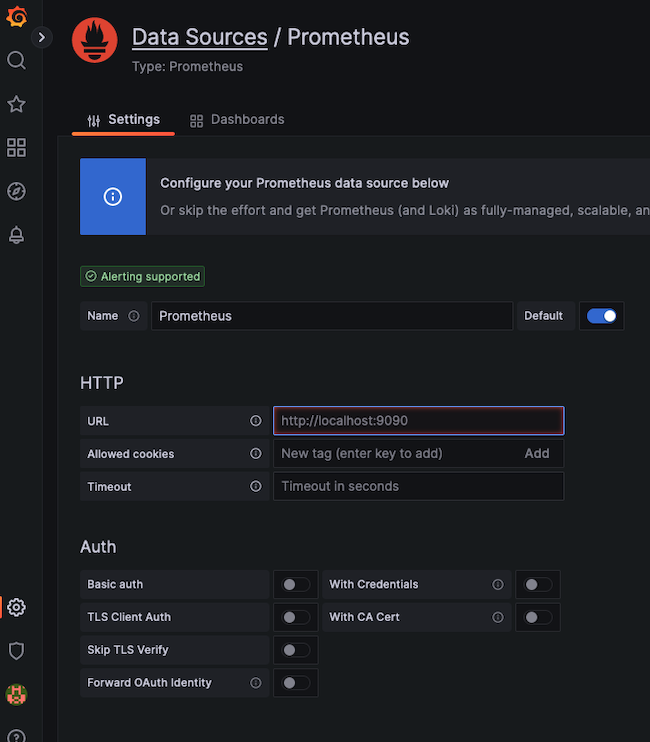
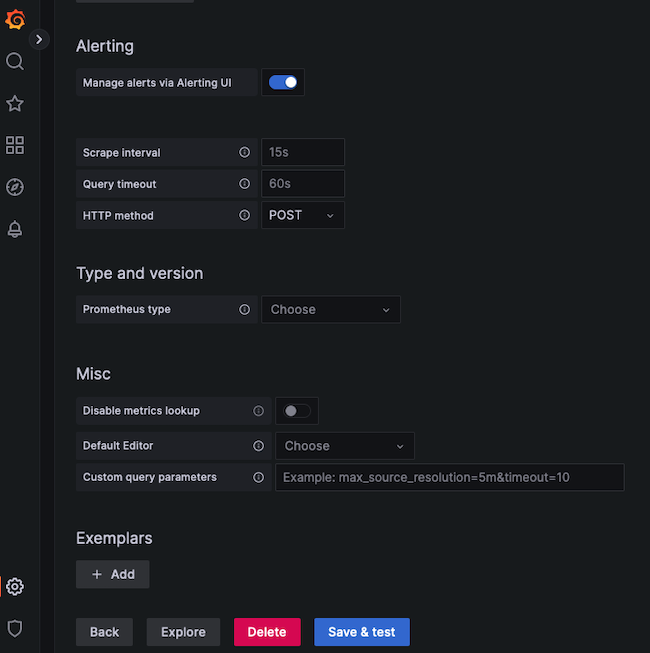
When satisfied with the settings, select the Save & test button at the bottom of the screen.
If all settings are correct, Grafana confirms the
Data source is working.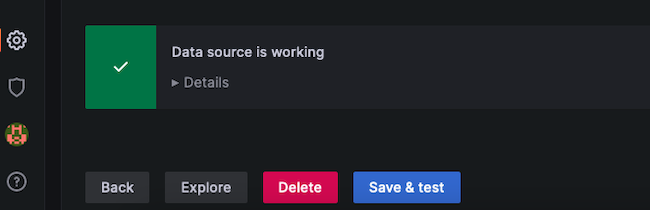
Import Dashboard
How to Import a Grafana Dashboard
A dashboard displays statistics for the client node using a more effective and standardized layout. It is certainly possible to create a custom dashboard. However, Prometheus has already created a dashboard to support the Node Exporter statistics. The Node Exporter Full dashboard neatly graphs most of the values collected from the client nodes. It is much less work to import this premade dashboard than to create a custom one.
Visit the Grafana Dashboard Library. Enter
Node exporteras the search term.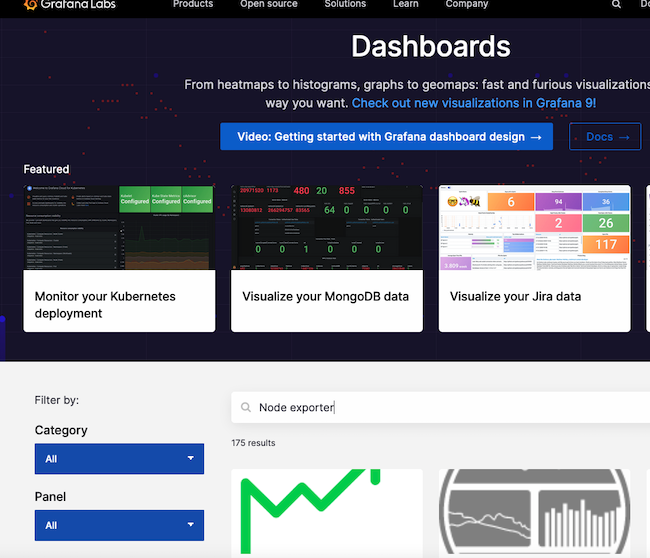
Select the entry for
Node Exporter Full.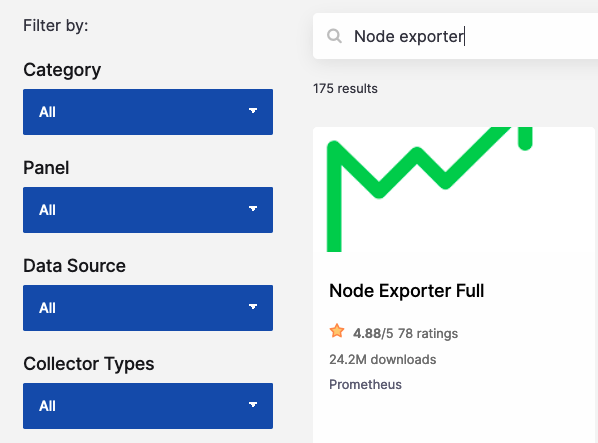
Make a note of the ID number or use the button to copy the ID to the clipboard. The ID of this board is currently
1860.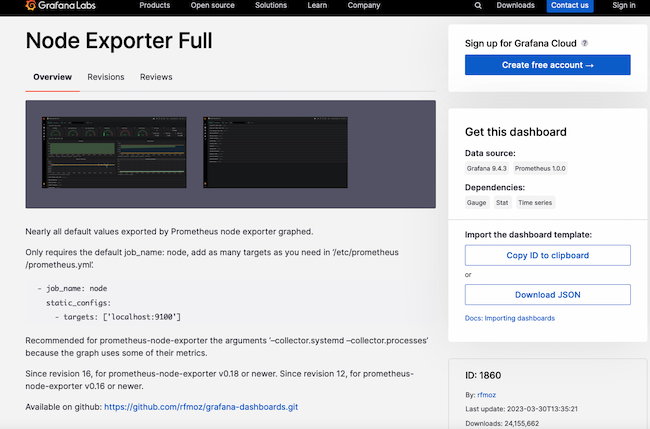
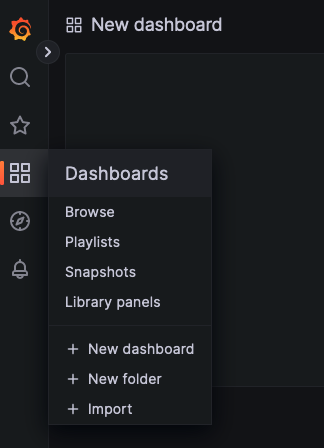
Return to the Grafana dashboard. Select the Dashboard icon, consisting of four squares, and choose + Import.
In the Import via grafana.com box, enter the ID
1860from the previous step. Then select the Load button.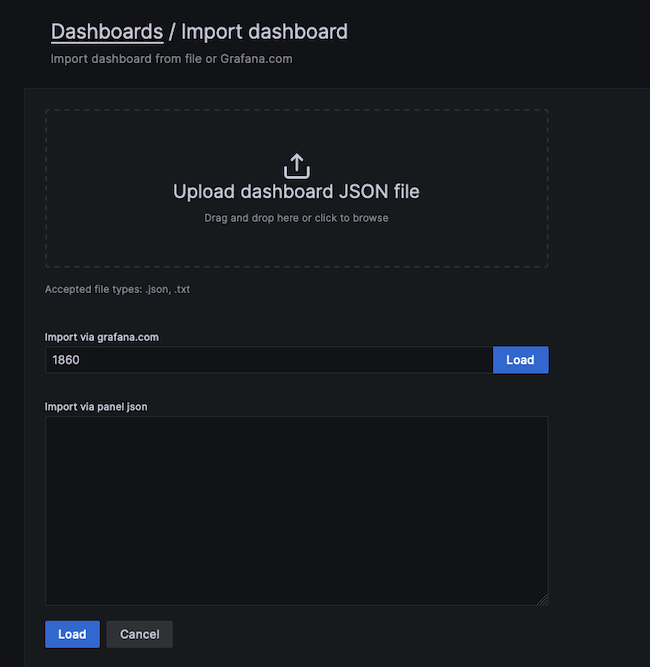
At the next screen, confirm the import details. Choose
Prometheusas the data source and click the Import button.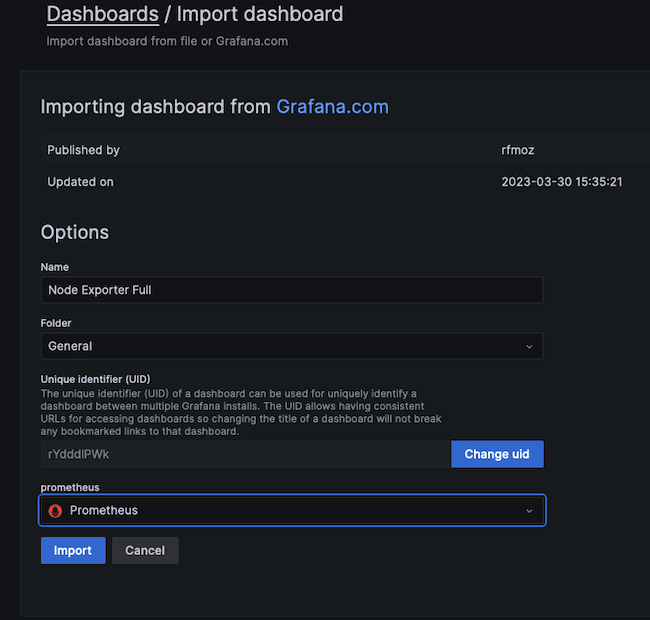
The
Node Exporter Fulldashboard takes effect immediately. It displays the performance metrics and state of the client node, including the Memory, RAM, and CPU details. Several drop-down menus at the top of the screen allow users to select the host to observe and the time period to highlight.The following example demonstrates how a client reacts when stressed by a demanding Python program. The
CPU Busywidget indicates how the CPU is pinned near the maximum. If this occurs during normal operating conditions, it potentially indicates more CPU power is required.
No Comments